- Original Paper
- Published:
Assessment of the specificity of cardiopulmonary response during tethered swimming using a new snorkel device
The Journal of Physiological Sciences volume 63, pages 7–16 (2013)
Abstract
This study aimed at comparing maximal oxygen uptake (VO2max), maximal heart rate (HRmax), and anaerobic threshold (AT) obtained from tethered swimming (SW) and three other testing procedures: cycling (CY), running (RU), and arm cranking (AC). Variables were assessed in 12 trained male swimmers by a portable gas analyzer connected to a modified snorkel system to allow expired gases collection during swimming. Athletes exhibited a higher VO2max during the SW test as compared to the CY and the AC tests. There was no significant difference in VO2max between the SW and the RU test, but the Bland and Altman plot highlighted a poor agreement between results. Moreover, AT occurred at higher workloads during SW in comparison to the other tests. These results do not support the use of any unspecific testing procedures to estimate VO2max, HRmax, and AT for swimming.
Introduction
The measurement of certain physiological parameters, such as maximal oxygen uptake (VO2max), heart rate (HR) at a given workload, and anaerobic threshold (AT), is a useful tool to assess athletes’ physical capacity and to follow the progression of conditioning during training periods. However, such measurements should be performed under conditions similar to those experienced by athletes during real training sessions or competitions and using specific ergometers, otherwise results can be misleading. This assumption is particularly critical in swimming, as standard laboratory testing for work capacity usually employs the cycle-ergometer, the treadmill, and the arm-crank, which impose movements that are unrelated to swimming. Moreover, the technical limitations of the routine measurement of expired gases in a pool explain why the research dealing with VO2max during this sport activity is not abundant.
To measure oxygen uptake (VO2) during swimming, a number of methods have been developed: the use of the Douglas bag to gather expired gas, thereby extrapolating VO2 [14, 15, 24, 29, 32]; VO2 calculation by means of back-extrapolation [22, 33, 34]; and finally the recent use of commercially available respiratory snorkels able to calculate VO2 together with other respiratory parameters such as pulmonary ventilation (VE) and carbon dioxide production (VCO2) [25–27, 30]. This latter method allows breath-by-breath analysis of gas exchange, thereby allowing the description of oxygen uptake kinetics during specific swimming exercise [25, 26]. At present, this latter method is probably more reliable and comfortable for swimmers than the Douglas bag and the back-extrapolation, since the first suffers from technical limitation due to the fact that the bag used to gather expired gases is somewhat cumbersome. Furthermore, it is usually connected to the athlete by two tubes with unidirectional valves, which renders the apparatus not very comfortable to wear. On the other hand, the back-extrapolation method is indirect and thus less accurate than methods employing direct gas exchange measures.
Limited previous research focusing on physical capacity during swimming led to conflicting results. Early reports in trained swimmers concluded that VO2max during swimming was similar or lower than during running [12, 14, 15]. Furthermore, higher VO2max values were found in triathletes during both cycling and running in comparison with swimming [17, 18], while these differences were not present in swimmers [30]. Taking into account these conflicting results, further research on gas exchange during swimming is warranted. Moreover, to the best of our knowledge, none has to date assessed the specificity of gas exchange measure in swimmers by using the respiratory snorkel method. In detail, none has compared the swimmers’ VO2 response assessed with the respiratory snorkel with other standard laboratory test procedures for work capacity, such as cycle-ergometry, treadmill, and arm-crank. In fact, the past research conducted with the snorkel method focused mainly on accumulated oxygen deficit, oxygen uptake kinetics, and oxygen cost of swimming [3, 4, 25–27]. Thus, a study dealing with the specificity of competitive swimmers’ cardiopulmonary responses assessed by the snorkel method during different exercise tests is needed.
Given the relative novelty of the snorkel device and the conflicting results arising from the past literature, the aim of this investigation was to study the difference in gas exchange responses provided by four different incremental tests in trained swimmers: three unspecific laboratory test procedures (i.e. arm-cranking, cycling, and running), and one specific swimming test in a pool. The goal was to determine whether any of the unspecific laboratory tests yielded results similar and interchangeable to those obtained from the specific swimming test and if so which.
Methods
Subjects
Twelve trained male swimmers were recruited to take part in this investigation. Their mean ± standard error (SE) of age, mass, and height were 19.2 ± 0.8 years, 68.9 ± 1.6 kg, and 177.3 ± 1.7 cm, respectively. All athletes were regularly involved in regional and national competitions and trained on average 12.5 ± 0.3 h a week. None had any history of cardiac or respiratory disease or was taking any medication at the time of the study, and none showed any abnormalities on physical examination and on resting electrocardiogram. Written informed consent was obtained by all of the participants after they were informed about the methods and aims of the study, whose protocol was approved by the local ethical committee and carried out according to the Declaration of Helsinki.
Experimental design
Each participant underwent the following protocol randomly assigned to eliminate any order effect:
-
1.
Unspecific tests: athletes underwent three laboratory incremental exercise tests up to exhaustion using three different ergometers:
-
(a)
Cycling (CY) test: participants performed an incremental test on an electromagnetically braked cycle ergometer (Tunturi EL 400, Finland) to assess the maximum workload achievable (W max). This test consisted of a linear increase of work load of 30 W min−1, starting from 40 W min−1, at a pedaling frequency of 60 rpm, up to exhaustion (i.e. the point when the participant was unable to maintain a pedaling rate of at least 50 rpm).
-
(b)
Running (RU) test: participants ran on a motorized treadmill (Runrace; Technogym, Forlì, Italy) up to exhaustion. The test consisted of a linear increase in running velocity of 1 km h−1 every minute, starting from 5 km h−1, up to exhaustion, which was considered as the exercise level at which the athlete was unable to maintain the running speed. The treadmill was set at a gradient of 1 % throughout exercise to compensate for the lack of air friction [19].
-
(c)
Arm-cranking (AC) test: which consisted of a linear increase in work load (10 W min−1), starting from 20 W min−1, at a cranking frequency of 60 rpm, up to exhaustion, taken as the point at which the athlete was unable to maintain a cranking rate of at least 50 rpm.
All unspecific tests were preceded by at least 10 min of rest. The average variable value of the last 3 min of resting was considered as the baseline level. Tests were conducted between 1000 and 1400 hours in a temperature-controlled room (room temperature set at 25 °C, relative humidity at 50 %).
-
(a)
-
2.
Specific swimming (SW) test: this test consisted in tethered swimming, conducted between 1000 and 1400 hours in a 25-m indoor swimming pool, under the same water condition (water temperature of 27 °C). The athlete was attached by a waist belt to an elastic rope connected to a digital dynamometer (PCE, FM1000, Germany) able to continuously provide a display of the values of the force being applied to the rope. The belt arrangement permitted the swimmers to kick freely. All swimmers performed front crawl with free stroke frequency. The other extremity of the dynamometer was fixed to the starting block of the pool (Fig. 1a). The tension applied to the elastic rope was constantly monitored on the display of the dynamometer, and continuous vocal feedback was provided to an assistant who moved a pole with a colored signal fixed at its extremity forward or backward immersed in the water. The tested swimmer was instructed to follow the colored signal so that the assistant could adjust the tension applied to the rope simply by moving forward or backward the pole. Using this method, an incremental test was developed, which started form a tension of 3 kg and was increased progressively by 1 kg min−1. The test terminated when the athlete was no longer able to maintain his position and to follow the colored signal for more than 30 s. The dynamometer had a computer interface which allowed the registration of the tension applied to the rope throughout tests. Figure 1b shows an example of the tension applied during one recording. Workload was calculated in kg m min−1 and then converted to W, the same unit as those obtained from the CY and the AC tests. The instrument range of measure was from 0 to 100 kg, with a resolution of 0.05 kg and an accuracy of 0.5 % (±5 N).
Fig. 1 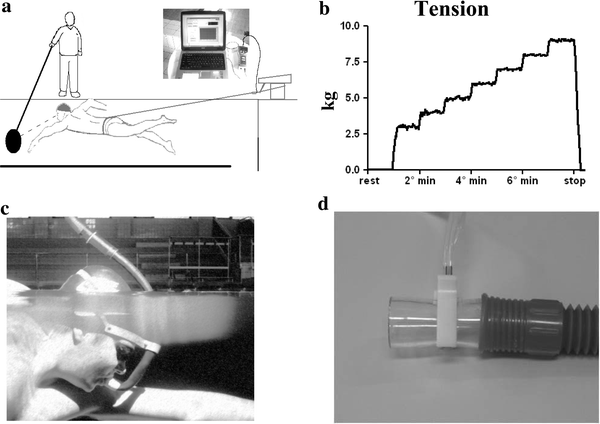
a Schematic representation of the tethered-swimming apparatus. b Example of the recording of the tension applied to the rope during the incremental swimming test. c, d The modified breathing valve to collect expired gases

Throughout the CY, RU, AC, and SW tests, participants’ expired gases were analyzed by a portable metabolic device (VO2000; MedicGraphics, USA), which provided a 3-breath average of VO2, VCO2, and pulmonary ventilation (VE) through telemetric transmission. This system has been shown to be reliable and to have show good agreement compared to a standard metabolic cart for laboratory use [9, 23]. Moreover, the VO2000 could gather HR values from a chest belt connected to the VO2000 by telemetric transmission. During the CY, RU, and AC tests, athletes wore a face mask and a breathing valve connected to the VO2000 for expired gases analysis. This system was modified for tethered swimming. In this setting, athletes breathed through a low volume (about 200 mL) corrugated flexible plastic tube attached to the VO2000 breathing valve (Fig. 1c, d). This modified system allowed expired gases to be collected, and prevented water from entering the analyzing system.
Tests were held at least 1 week apart, and athletes were asked to have a meal at least 3 h before testing. Athletes were also asked to avoid caffeine and alcohol ingestion the day before tests were scheduled. The anaerobic threshold was determined using the V-slope method, which detects AT by using computerized regression analysis of the slopes of the VCO2 versus VO2 plot during exercise [6]. Achievement of VO2max was considered as the attainment of at least 2 of the following criteria: (1) a plateau in VO2 despite increasing; (2) a respiratory exchange ratio (RER) above 1.10; and (3) a heart rate (HR) ±10 beats min−1 of predicted maximum HR calculated as 220 − age [16]. Prior to testing, the VO2000 was calibrated according to the manufacturer’s instructions. For the calibration during the SW tests, the additional dead space of the plastic tube was taken into account by modifying the pre-set parameters of the VO2000.
Additional experiments to assess the modified expired gas analysis system
Since the additional dead space of the modified expired gas analysis system could affect the respiratory response during swimming, in a sub-group of the participants (n = 4, age 20.1 ± 4.4 years, height 179.2 ± 2.3 cm, and mass 69.3 ± 4.2 kg), additional experiments were performed, consisting of two randomly assigned incremental tests to exhaustion on the same cycle ergometer used for the CY tests. In one test, athletes breathed through the modified gas analysis system, while in the other test, expired gasses were collected by the standard VO2000 system.
Calculation and data analysis
Data were averaged for 1 min and displayed as a function of % of maximal workload achieved (W max) during each test. Results are presented as mean ± SE. Bland and Altman statistics [7] to assess agreement between two methods of measurement were carried out in order to evaluate agreement between variables responses during the SW test and the other unspecific tests. Since it has been previously described that the test–retest reproducibility of VO2max in verification tests ranged between 3.5 and 7.1 %, depending on errors in measurements introduced by exercise protocols and by gas analyser devices, and that a threshold around 5 % is often used to compare different exercise protocols to assess the “true” VO2max [2, 21, 31], we chose the 5 % difference as the limit to consider methods interchangeable in parameter assessment. The repeated measures analysis of variance (ANOVA), followed by Dunnet post hoc tests when appropriated to compare SW data to those from the other tests, were also performed in order to have further comparison between tests. Moreover, the two-way ANOVA for repeated measures (factors of time and condition) was conducted for the additional experiment session (i.e. when subjects breathed through the modified gas analysis system or through the standard VO2000 while cycling) in order to find out whether or not the modified expired gas analysis device affected the respiratory parameters.
Significance was set at a p value <0.05. Descriptive statistics were carried out before the ANOVA to confirm the assumptions of normality by means of the Kolmogorov–Smirnov test. The alpha level was set at p < 0.05. Statistics were calculated employing commercially available software (Graph-Pad Prism).
Results
All participants fulfilled the selected criteria for VO2max achievement in all tests performed. The W max values achieved during the CY, RU, AC, and SW tests were 312.5 ± 9.3 W min−1, 15.2 ± 0.4 km h−1, 90.1 ± 10.1 W min−1, and 8.9 ± 0.3 kg m min−1 (i.e. 87.3 ± 2.9 W min−1), respectively.
Figure 2 illustrates the HR and VO2 time courses as a function of % of W max throughout the tests and recovery. During all tests, variables increased almost linearly with respect to workload. Figure 3 shows the HRmax level reached during each test together with the Bland and Altman plots. ANOVA found that HRmax was lower during the SW test in comparison to the RU and the AC tests, whereas no difference was found between the SW and the CY tests. The Bland and Altman plot highlighted that limits of agreement of the difference in HRmax between the SW and the other tests were widespread. The most evident difference was with respect to the RU test, with limits of agreement lying between +2.6 and −32.3 bpm. This difference was also evident with respect to the CY test (limits of agreement between +17.4 and −24.9 bpm), notwithstanding that ANOVA did not find any significant difference between these two tests. In terms of % difference, the mean difference between the SW and the CY tests was −2.2 %, with limits of agreement between +10.3 and −14.8 %. It should also be noticed that 7 of the 12 subjects studied had a difference between tests higher than 5 %.

HR and VO2 time courses as a function of % of W max throughout the various tests of the protocol and recovery

HRmax level reached during each test together with the Bland and Altman plots. The dotted lines identify the limits of the 5 % difference between methods. p < 0.05 versus the SW test
Figure 4 exhibits the levels attained of VO2max. ANOVA showed that, during the SW test, athletes achieved higher VO2max levels as compared to the CY and the AC tests, while no difference was found between the SW and RU tests. Bland and Altman plots demonstrated that limits of agreement of the difference in VO2max between the SW and the other tests lay between +1,117 and −1,367, +1,012 and −241, +1,212 and −380 mL min−1 for the RU, CY, and AC tests, respectively. Although ANOVA did not find any difference between the SW and RU tests, it should be considered that the limits of agreement between these two tests were wide. In terms of % difference, the mean difference between the SW and RU tests was −3.5 %, with limits of agreement between +30.8 and −38 %. Moreover, 7 of the 12 studied subjects had a difference between tests higher than 5 %.

VO2max level reached during each test together with the Bland and Altman plots. The dotted lines identify limits of the 5 % difference between methods. p < 0.05 versus the SW test
During the SW test, AT occurred at a higher % of W max in comparison with all the other tests (Fig. 5). The Bland and Altman plot showed that the limits of agreement for this parameter were between +45.5 and −12.4, +43.4 and −8.1, +41.9 and −16.3 % of W max for the RU, CY, and AC tests, respectively.

AT level reached during each test together with the Bland and Altman plots. The dotted lines identify limits of the 5 % difference between methods. p < 0.05 versus the SW test
Figure 6 shows the results from the session of additional experiments to assess the modified gas exchange system. No significant difference was found in VO2 and VCO2 responses between the incremental test with the modified gas analysis system and the test performed with the standard VO2000 equipment. However, it should be highlighted that the use of the snorkel caused a slight VE and HR increment at sub-maximal workloads with respect to free breathing. Indeed, HR was higher at rest and during the first exercise steps (up to 40 % of maximum workload) while subjects breathed throughout the snorkel than while they breathed with the standard equipment. Similarly, VE was higher at rest up to 30 % of maximum workload when athletes used the modified snorkel.

Results from the session of additional experiments to assess the modified gas exchange system
Discussion
Since it is considerably simpler to obtain VO2 measures in a laboratory setting, it is tempting to predict VO2 for swimming from laboratory procedures. One of the purposes of this study was to determine whether non-specific laboratory tests provided results similar to those obtained from specific swimming testing procedures. This purpose had the practical implication to determine whether any of the unspecific laboratory tests could be used interchangeably with specific testing in order to assess swimmers’ physical capacity and if so which. Results from the present study do not support the use of any unspecific tests to estimate VO2 for swimming, as none of the three laboratory tests employed in the present study provided data similar to those obtained from the specific test. To the best of our knowledge, this study is the first to compare competitive swimmers’ cardiopulmonary responses assessed with the respiratory snorkel with other standard laboratory test procedures for work capacity. Hence, these are the first results obtained with the snorkel method demonstrating the uniqueness of swimming testing with respect to laboratory procedures for exercise capacity.
In fact, tethered swimming induced a higher VO2max response as compared to cycling and cranking, as suggested by the ANOVA results and further strengthened by Bland and Altman statistics. Moreover, even though ANOVA did not find any difference between the SW and RU tests, results from the Bland and Altman plot highlighted that the limits of agreement of the difference in VO2max between these two testing procedures were wide. In detail, the Bland and Altman plot demonstrated that the limits of agreement of the difference in VO2max between the SW and RU tests were between +1,117 and −1,367 mL min−1. In terms of % difference, this was between +30.8 and −38 %, with 7 of the 12 studied subjects showing a difference between tests higher than 5 %. It should be noted that the test–retest reproducibility of VO2max in verification tests previously described in the scientific literature ranged between 3.5 and 7.1 %, depending on errors in measurements introduced by exercise protocols and by gas analyzer devices, and that a threshold around 5 % is often used to compare different exercise protocols to assess the “true” VO2max [2, 21, 31]. That is, the difference in VO2max yielded by two methods must not exceed this threshold to consider the two methods equivalent in assessing this parameter. In the present investigation, only in 5 of the 12 subjects enrolled this threshold was exceeded, and this fact meant that, in most of the subjects, the RU and SW tests could not be used interchangeably. Taken together, these results indicated that the use of the RU test could lead to substantial over- or under-estimation of the VO2max reached during real swimming.
Similarly, the laboratory tests also led to misleading results for HRmax, as this parameter was on average over-estimated by the RU and AC tests with respect to the SW test, as testified by ANOVA results. On average, this parameter was not significantly different between the CY and SW tests when looking at ANOVA alone. However, the limits of agreement of the HRmaxSW − HRmaxCY difference showed a great dispersion. Indeed, the limits of agreement were between +17.4 and −24.9 bpm (+10.3 and −14.8 % in terms of % difference), with 7 of the 12 studied subjects showing a difference between tests higher than 5 %. All these facts suggested that substantial errors could be made when extrapolating HRmax in swimming from the cycling test. An even more striking difference was found when comparing the workload levels at which AT occurred. In fact, during the SW test, AT was detected at a higher % of W max (at about 82 %) compared to all the other tests.
Since swimming requires less muscle mass (predominantly upper body) than running and cycling, it is tempting to assume that running and cycling testing should lead to a higher VO2max than swimming. However, in the present study, this was not the case as the results showed that swimmers had on average a similar VO2max level during the SW and RU tests, whereas they had an even higher VO2max during the SW test as compared to the CY test. This fact could be explained by taking into account that VO2max is training-sensitive. Hence, swimming training could induce in swimmers some specific adaptations leading to VO2max enhancement only in their specific activity. It has in fact been suggested that the specifics of training affects the metabolic response of the musculature employed, and thus the metabolic response is specific to the training mode [14, 15, 20]. This is in accordance with what has been recently found by Roels and co-workers [30], who reported that swimmers had a higher VO2max when assessed during swimming than during cycling. However, it is in contrast to earlier studies reporting that, in elite swimmers, VO2max was lower during swimming than during running [14, 15]. We cannot explain these conflicting results. However, it should be noted that the earlier studies quoted used the Douglas bag technique. This apparatus is cumbersome and not very comfortable to wear. Hence, it is possible that the Douglas bag limited athletes’ movements so that they did not produce their top performance. In contrast, in the study by Roels et al. [30], who reported results similar to those of the present investigation, a snorkel similar to that of our investigation was employed. Thus, the different techniques used to collect expiratory gasses may explain the different outcomes of the various studies.
Another fact deserving attention is that the most striking difference between the SW test and the unspecific tests was found for AT, which occurred at a mean of 82.2 % of W max during swimming, a value about 15–20 % higher than those detected in the other tests. Likewise for VO2max, this fact could be the consequence of the specific adaptations induced by swimming training that enhanced the metabolic response during the specific exercise activity. This finding suggests that AT is more sensitive than VO2max in detecting the specificity of training and that AT should be preferentially used when evaluating swimmers’ fitness status. This conclusion is in good agreement with the concept that VO2max is a valuable tool to distinguish between fit and unfit subjects, but it is not sensitive enough to discriminate between subjects of homogenous performance levels, since it suffers from limitations due to the fact that adequate motivation of the exercising subject is necessary to appropriately determine VO2max, while sub-maximal parameters such as AT are less sensitive to motivation [13]. Moreover, while VO2max reflects the integration of several mechanisms (ventilation, cardiac output, peripheral muscle O2 extraction, etc.), AT mainly reflects type II (fast-twitch glycolitic) muscle fibers recruitment, which are sensitive to training. In fact, the VO2 slow component, which is supposed to be linked to progressive recruitment of type II muscle fibers, has been described as being reduced in swimmers with a higher ventilatory threshold [25], thereby suggesting that mechanisms related to muscle recruitment are more specific indicators of athletes’ fitness status than VO2max. Thus, AT appears to be more sensitive than VO2max for detecting the specificity of training. It has in fact been reported that anaerobic and ventilatory thresholds are important variables distinguishing endurance performance in athletes homogeneous in terms of VO2max [5], and that AT is a more useful indicator of aerobic endurance performance than VO2max [1, 13].
As far as HRmax is concerned, this variable showed a clear tendency to be lower in response to the SW than during the other tests. This fact is not novel since most of the research dealing with comparison between swimming and other kinds of effort has led to similar results [15, 28, 30]. Several factors could be responsible for the phenomenon: the different body position that improves cardiac filling and stroke volume, thereby reducing HR at a given cardiac output; the enhanced vagal tone due to water immersion; and the reduced muscle mass used when swimming.
Limitations of the study
Some technical considerations about the present investigation need to be acknowledged. First, as concerns the validity of the method employed in the present study, it should be emphasized that, from a biomechanical point of view, tethered swimming is different from free swimming since, among other factors, it does not take into account some critical aspects such as active and passive drag [10, 11]. However, previous research has reported that tethered swimming yielded essentially identical VO2max values as free and flume swimming, thus indicating that results from tethered swimming tests were highly correlated with those of free swimming [8]. Another fact was that the additional dead space of the snorkel apparatus is likely to cause hyperventilation. However, results from additional experiments conducted with and without the snorkel suggested that VE was slightly increased by the snorkel only at sub-maximal workloads as compared to free breathing. Similarly to what has been described for VE, the snorkel device also induced a slight HR increase only at submaximal workloads. In contrast, the VO2 and VCO2 responses were substantially unaffected by the apparatus. Taken together, these facts led us to assume that the dead space added by the snorkel did not influence the outcome of the present study, which mainly focused on variables at AT and at maximum workload, i.e. when the snorkel device did not appear to significantly affect physiological response. Furthermore, athletes’ mean value of VO2max achieved (54.6 mL/kg/min, range 46.5–66.7 mL/kg/min) and workload level at AT (82.2 % of W max) were similar to those reported by previous studies in competitive swimmers [25, 27, 30], thus suggesting that the method employed in the present study yielded results comparable to those obtained by using a different commercially available snorkel.
Taken together, our data seem to support the snorkel method as a valid tool to assess swimmers’ physical capacity in the pool setting. This method, although expensive, has been previously employed to assess the specificity of oxygen uptake kinetics, oxygen deficit, and energy cost in swimming [3, 4, 25, 26]. The present investigation provides further evidence that it is also suitable for VO2max and AT assessment.
In conclusion, the present investigation provides evidence that none of the laboratory tests utilized to measure oxygen uptake in swimmers yielded results comparable to those obtained by tethered swimming testing. This fact strengthens the concept that swimmers should be tested in their specific activity and that predicting VO2max for swimming from other exercise testing procedures should be avoided. Moreover, the most specific parameter appears to be the anaerobic threshold, which shows the most relevant difference between swimming and the other tests.
References
Allen WK, Seals DR, Hurley BF, Ehsani AA, Hagberg JM (1985) Lactate threshold and distance running performance in young and older endurance athletes. J Appl Physiol 58:1281–1284
Bagger M, Petersen PH, Pedersen PK (2003) Biological variation in variables associated with exercise training. Int J Sports Med 24:433–440
Barbosa TM, Keskinen KL, Fernandes R, Colaco P, Carmo C, Vilas-Boas JP (2005) Relationship between energetic, stroke determinants, and velocity in butterfly. Int J Sports Med 26:841–846
Barbosa TM, Fernandes R, Keskinen KL, Colaco P, Cardoso C, Silva J, Vilas-Boas JP (2006) Evaluation of the energy expenditure in competitive swimming strokes. Int J Sports Med 27:894–899
Basset Dr Jr, Howley ET (2000) Limiting factors for maximum oxygen uptake and determinants of endurance performance. Med Sci Sports Exerc 32:70–84
Beaver WL, Wasserman K, Whipp BJ (1986) A new method for detecting anaerobic threshold by gas exchange. J Appl Physiol 60:2020–2027
Bland JM, Altman DG (1986) Statistical methods for assessing agreement between two methods of clinical measurement. Lancet 1:307–310
Bonen A, Wilson A, Yarkony M, Belcastro AN (1980) Maximal oxygen uptake during free, tethered, and flume swimming. J Appl Physiol 48:232–235
Byard AD, Dengel DR (2002) Validity of a portable metabolic measurement system. Med Sci Sport Exerc 34:S149
Capelli C, Pendergast DR, Termin B (1998) Energetics of swimming at maximal speeds in humans. Eur J Appl Physiol 78:385–393
Di Prampero PE (1986) The energy cost of human locomotion on land and in water. Int J Sports Med 7:55–72
Dixon RW, Faulkner J (1971) Cardiac output during maximum effort running and swimming. J Appl Physiol 30:653–656
Faude O, Kindermann W, Meyer T (2000) Lactate threshold concepts. Sports Med 39:469–490
Holmér I, Astrand P (1972) Swimming training and maximal oxygen uptake. J Appl Physiol 33:510–513
Holmér I, Lundin A, Eriksson B (1974) Maximum oxygen uptake during swimming and running by elite swimmers. J Appl Physiol 36:711–714
Howley ET, Bassett DR, Welch HG (1995) Criteria for maximal oxygen uptake: review and commentary. Med Sci Sport Exerc 27:1292–1301
Kohrt WM, Morgan DW, Bates B, Skinner JS (1987) Physiological responses of triathletes to maximal swimming, cycling, and running. Med Sci Sport Exerc 19:51–55
Kohrt WM, O’Connor JS, Skinner JS (1989) Longitudinal assessment of responses by triathletes to swimming, cycling, and running. Med Sci Sport Exerc 21:569–575
Jones AM, Doust JH (1996) A 1 % treadmill grade most accurately reflects the energetic cost of outdoor running. J Sport Sci 14:321–327
Magel JR, Foglia GF, McArdle WD, Gutin B, Pechar GS, Katch FI (1975) Specificity of swim training on maximum oxygen uptake. J Appl Physiol 38:151–155
Midgley AW, Carroll S (2009) Emergence of the verification phase procedure for confirming “true” VO2max. Scand J Med Sci Sports 19:313–322
Montpetit R, Léger LA, Lavoie JM, Cazorla G (1981) VO2peak during free swimming using the backward extrapolation of the O2 recovery curve. Eur J Appl Physiol 47:385–391
Olson TP, Tracy JE, Dengel DR (2003) Validity of a low-flow pneumotach and portable metabolic system for measurement of basal metabolic rate. Med Sci Sport Exerc 35:S143
Poujade B, Hautier CA, Rouard A (2002) Determination of the energy cost of front-crawl swimming in children. Eur J Appl Physiol 87:1–6
Reis JF, Alves FB, Bruno PM, Vleck V, Millet GP (2012) Effects of aerobic fitness on oxygen uptake kinetics in heavy intensity swimming. Eur J Appl Physiol 112:1689–1697
Reis JF, Alves FB, Bruno PM, Vleck V, Millet GP (2012) Oxygen uptake kinetics and middle distance swimming performance. J Sci Med Sport 15:58–63
Reis VM, Marinho DA, Barbosa FP, Reis AM, Guidetti L, Silva AJ (2010) Examining the accumulated oxygen deficit method in breakstroke swimming. Eur J Appl Physiol 109:1129–1135
Rennie DW, Di Prampero PE, Cerretelli P (1971) Effects of water immersion on cardiac output, heart rate and stroke volume of man at rest and during exercise. Med Sport 24:222–228
Ribeiro JP, Cadavid E, Baena J, Monsalvete E, Barna A, De Rose EH (1990) Metabolic predictors of middle-distance swimming performance. Br J Sports Med 24:196–200
Roels B, Schmitt L, Libicz S, Bentley D, Richalet J-P, Millet G (2005) Specificity of VO2max and the ventilatory threshold in free swimming and cycle ergometry: comparison between triathletes and swimmers. Br J Sports Med 23:965–968
Scharag-Rosemberg F, Carlsohn A, Cassel M, Mayer F, Scharhag J (2011) How to test maximal oxygen uptake: a study on timing and testing procedure of a supramaximal verification test. Appl Physiol Nutr Metab 36:153–160
Smith DJ, Norris SR, Hogg JM (2002) Performance evaluation of swimmers. Sports Med 32:539–554
Zamparo P, Bonifazi M, Faina M, Milan A, Sardella F, Schena F, Capelli C (2005) Energy cost of swimming of elite long-distance swimmers. Eur J Appl Physiol 94:697–704
Zamparo P, Capelli C, Cautero M, Di Nino A (2000) Energy cost of front-crawl swimming at supra-maximal speeds and underwater torque in young swimmers. Eur J Appl Physiol 83:487–491
Acknowledgments
This study was supported by the University of Cagliari, the Italian Ministry of Scientific Research, and the National Olympic Committee of Italy. The authors wish to thank Mr. Corrado Sorrentino, Mr. Cesare Floris, Mr. Marco Cara, and the Atlantide Elmas, Rari Nantes Cagliari, and Esperia Cagliari sport clubs for their collaboration.
Conflict of interest
None.
Author information
Authors and Affiliations
Corresponding author
Rights and permissions
About this article
Cite this article
Pinna, M., Milia, R., Roberto, S. et al. Assessment of the specificity of cardiopulmonary response during tethered swimming using a new snorkel device. J Physiol Sci 63, 7–16 (2013). https://doi.org/10.1007/s12576-012-0226-7
Received:
Accepted:
Published:
Issue Date:
DOI: https://doi.org/10.1007/s12576-012-0226-7